5 projects on
Hi, I'm Purva Masurkar 👋
I’m a passionate Data Analyst based out of Ireland 🇮🇪 with a Master’s Degree in Business Analytics from the University of Galway.

Data Driven
Business Insights


Years of Experience

H1:1
First Class Honours


CSPO
Certified ®

Data isn't just numbers—it's stories waiting to be told. I am passionate about unearthing the stories hidden in your data so that you can understand your business better.
After nearly three years of analyzing data at Accenture, I wanted to dive deeper into understanding how businesses work with data. So, I decided to come to Ireland for my master’s. Now that I’ve learned more about data and business analysis, I am discovering new ways to make sense of information and looking forward to helping companies make better decisions.

Winner of Employee of the Month Award at my previous employer - Accenture
My toolbelt
Technologies I use to unlock insights
These are the top 6 key skills I use regularly for my data analysis work. I am also experienced in stakeholder management, requirement gathering, and user stories.
In addition to this, I am also able to work with the R, and C# programming languages.
SQL and SQL Server
Mastering the language of data with SQL and SQL Server for seamless database querying and manipulation.
Tableau
Crafting visually stunning insights with Tableau for impactful data visualization.
Python
Harnessing the versatility of Python for advanced data analysis and automation.
Excel
Transforming raw data into actionable insights with Excel's VBA and Pivot tables.
Data Modelling
Constructing robust data models to unlock patterns and predict future trends.
Microsoft 365
Leveraging the collaborative power of Microsoft 365 to streamline data workflows and enhance productivity.
Recent Projects 📈
From Tableau to Python – explore my wide range of projects. It’s a work in progress!
Tableau Dashboard
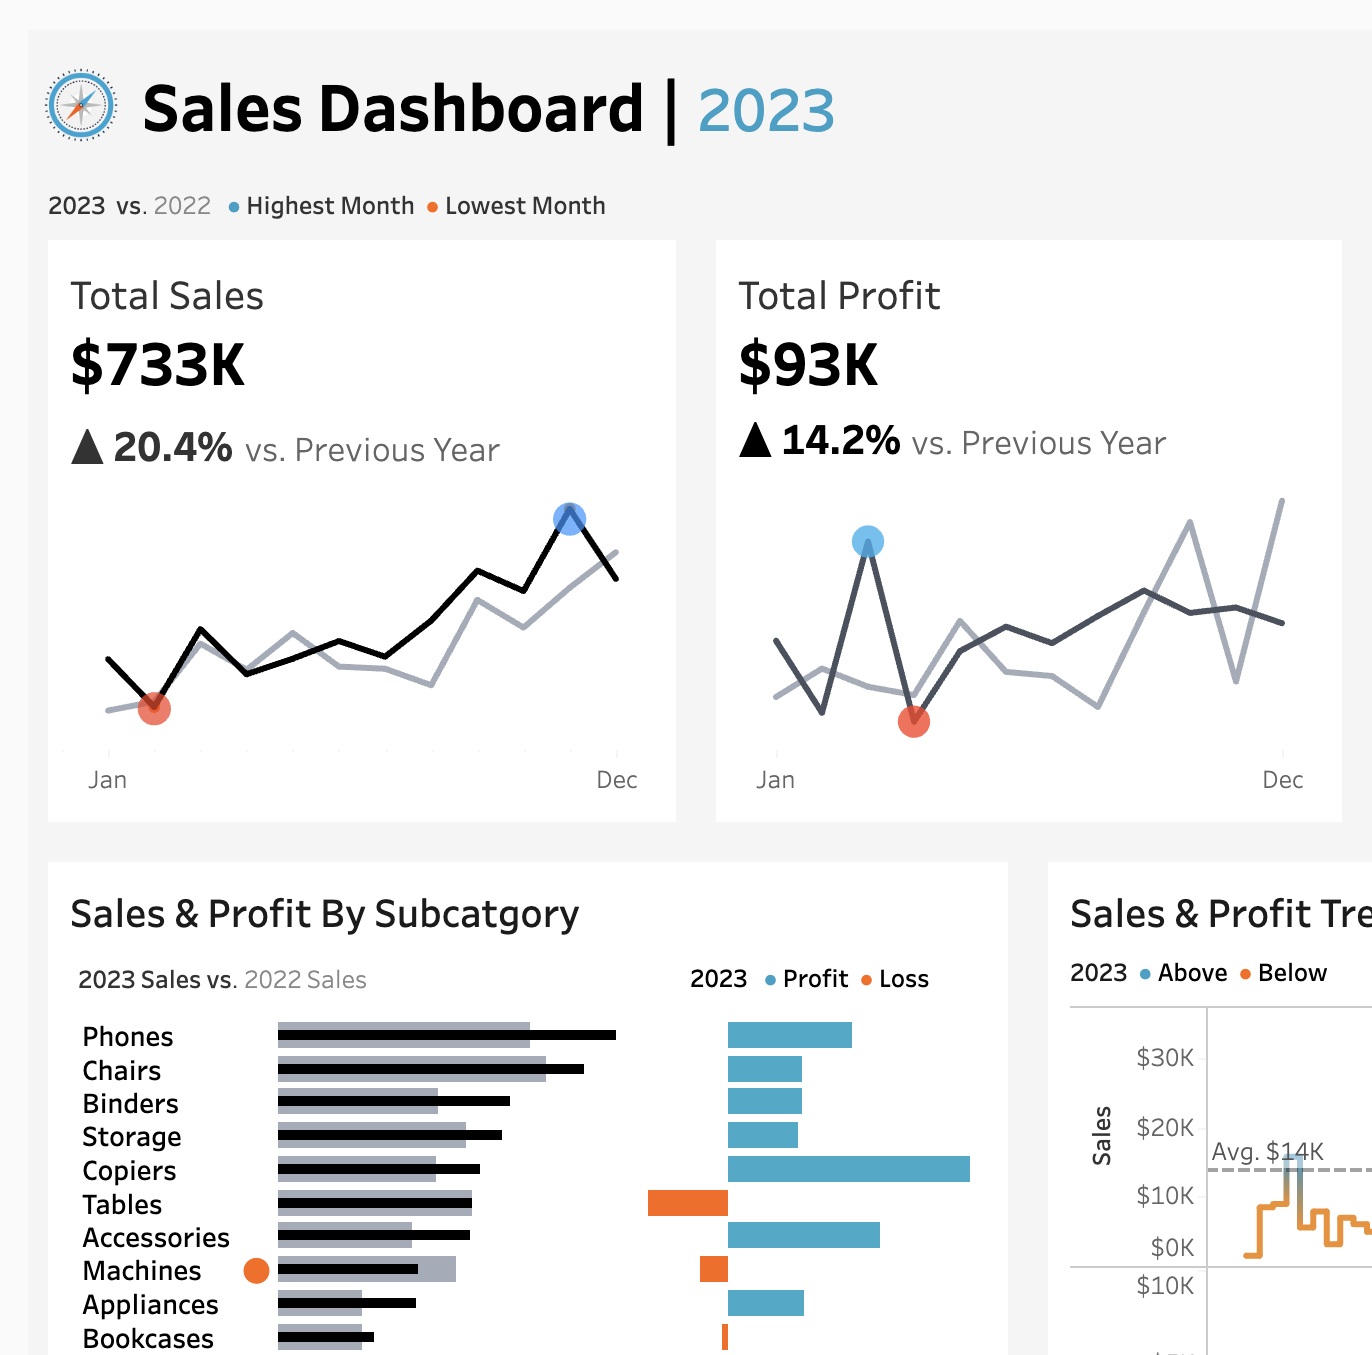
Interactive Sales Dashboard in Tableau 📊
The purpose of the sales dashboard is to present an overview of the sales key performance metrics and trends to analyse year-over-year sales performance and understand sales trends.
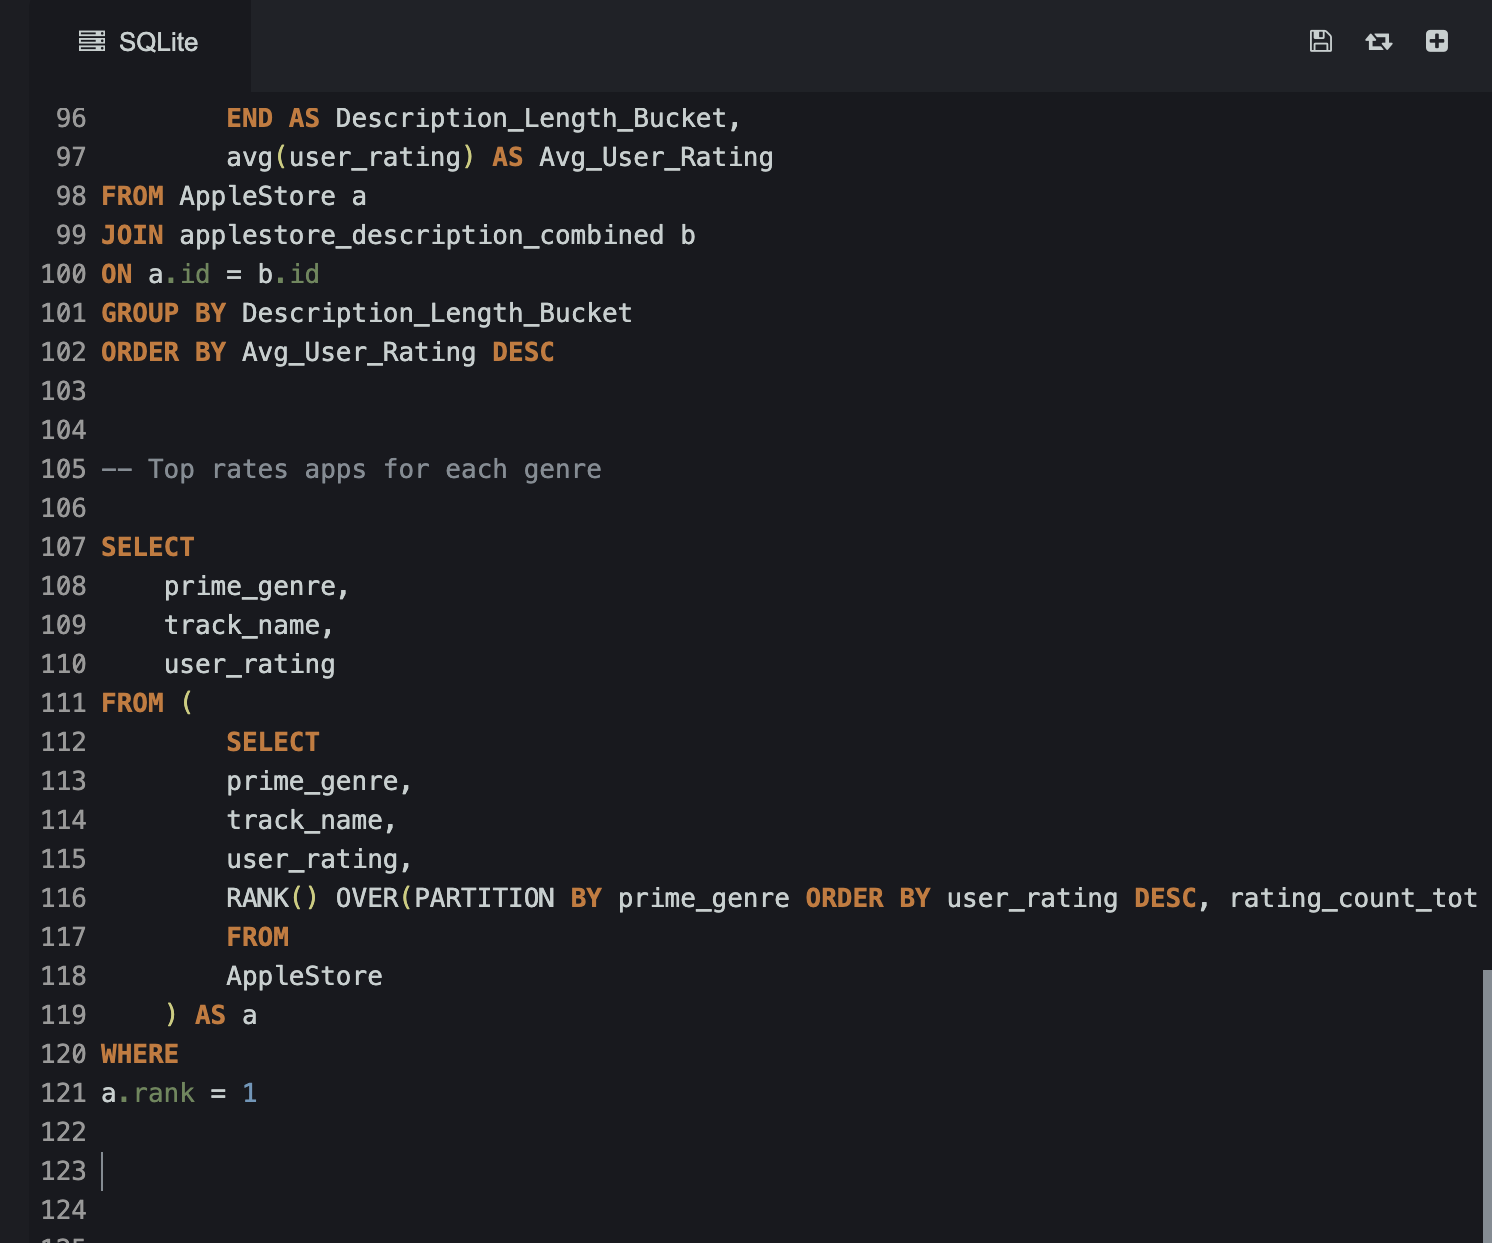
Exploring Apple Store App Data using SQL 📱
During a casual conversation with my app developer friend, his search for a new app idea sparked a thought: What truly drives app success in today’s saturated market? This led me to explore the world of app data analysis, aiming to uncover the secrets behind successful apps.
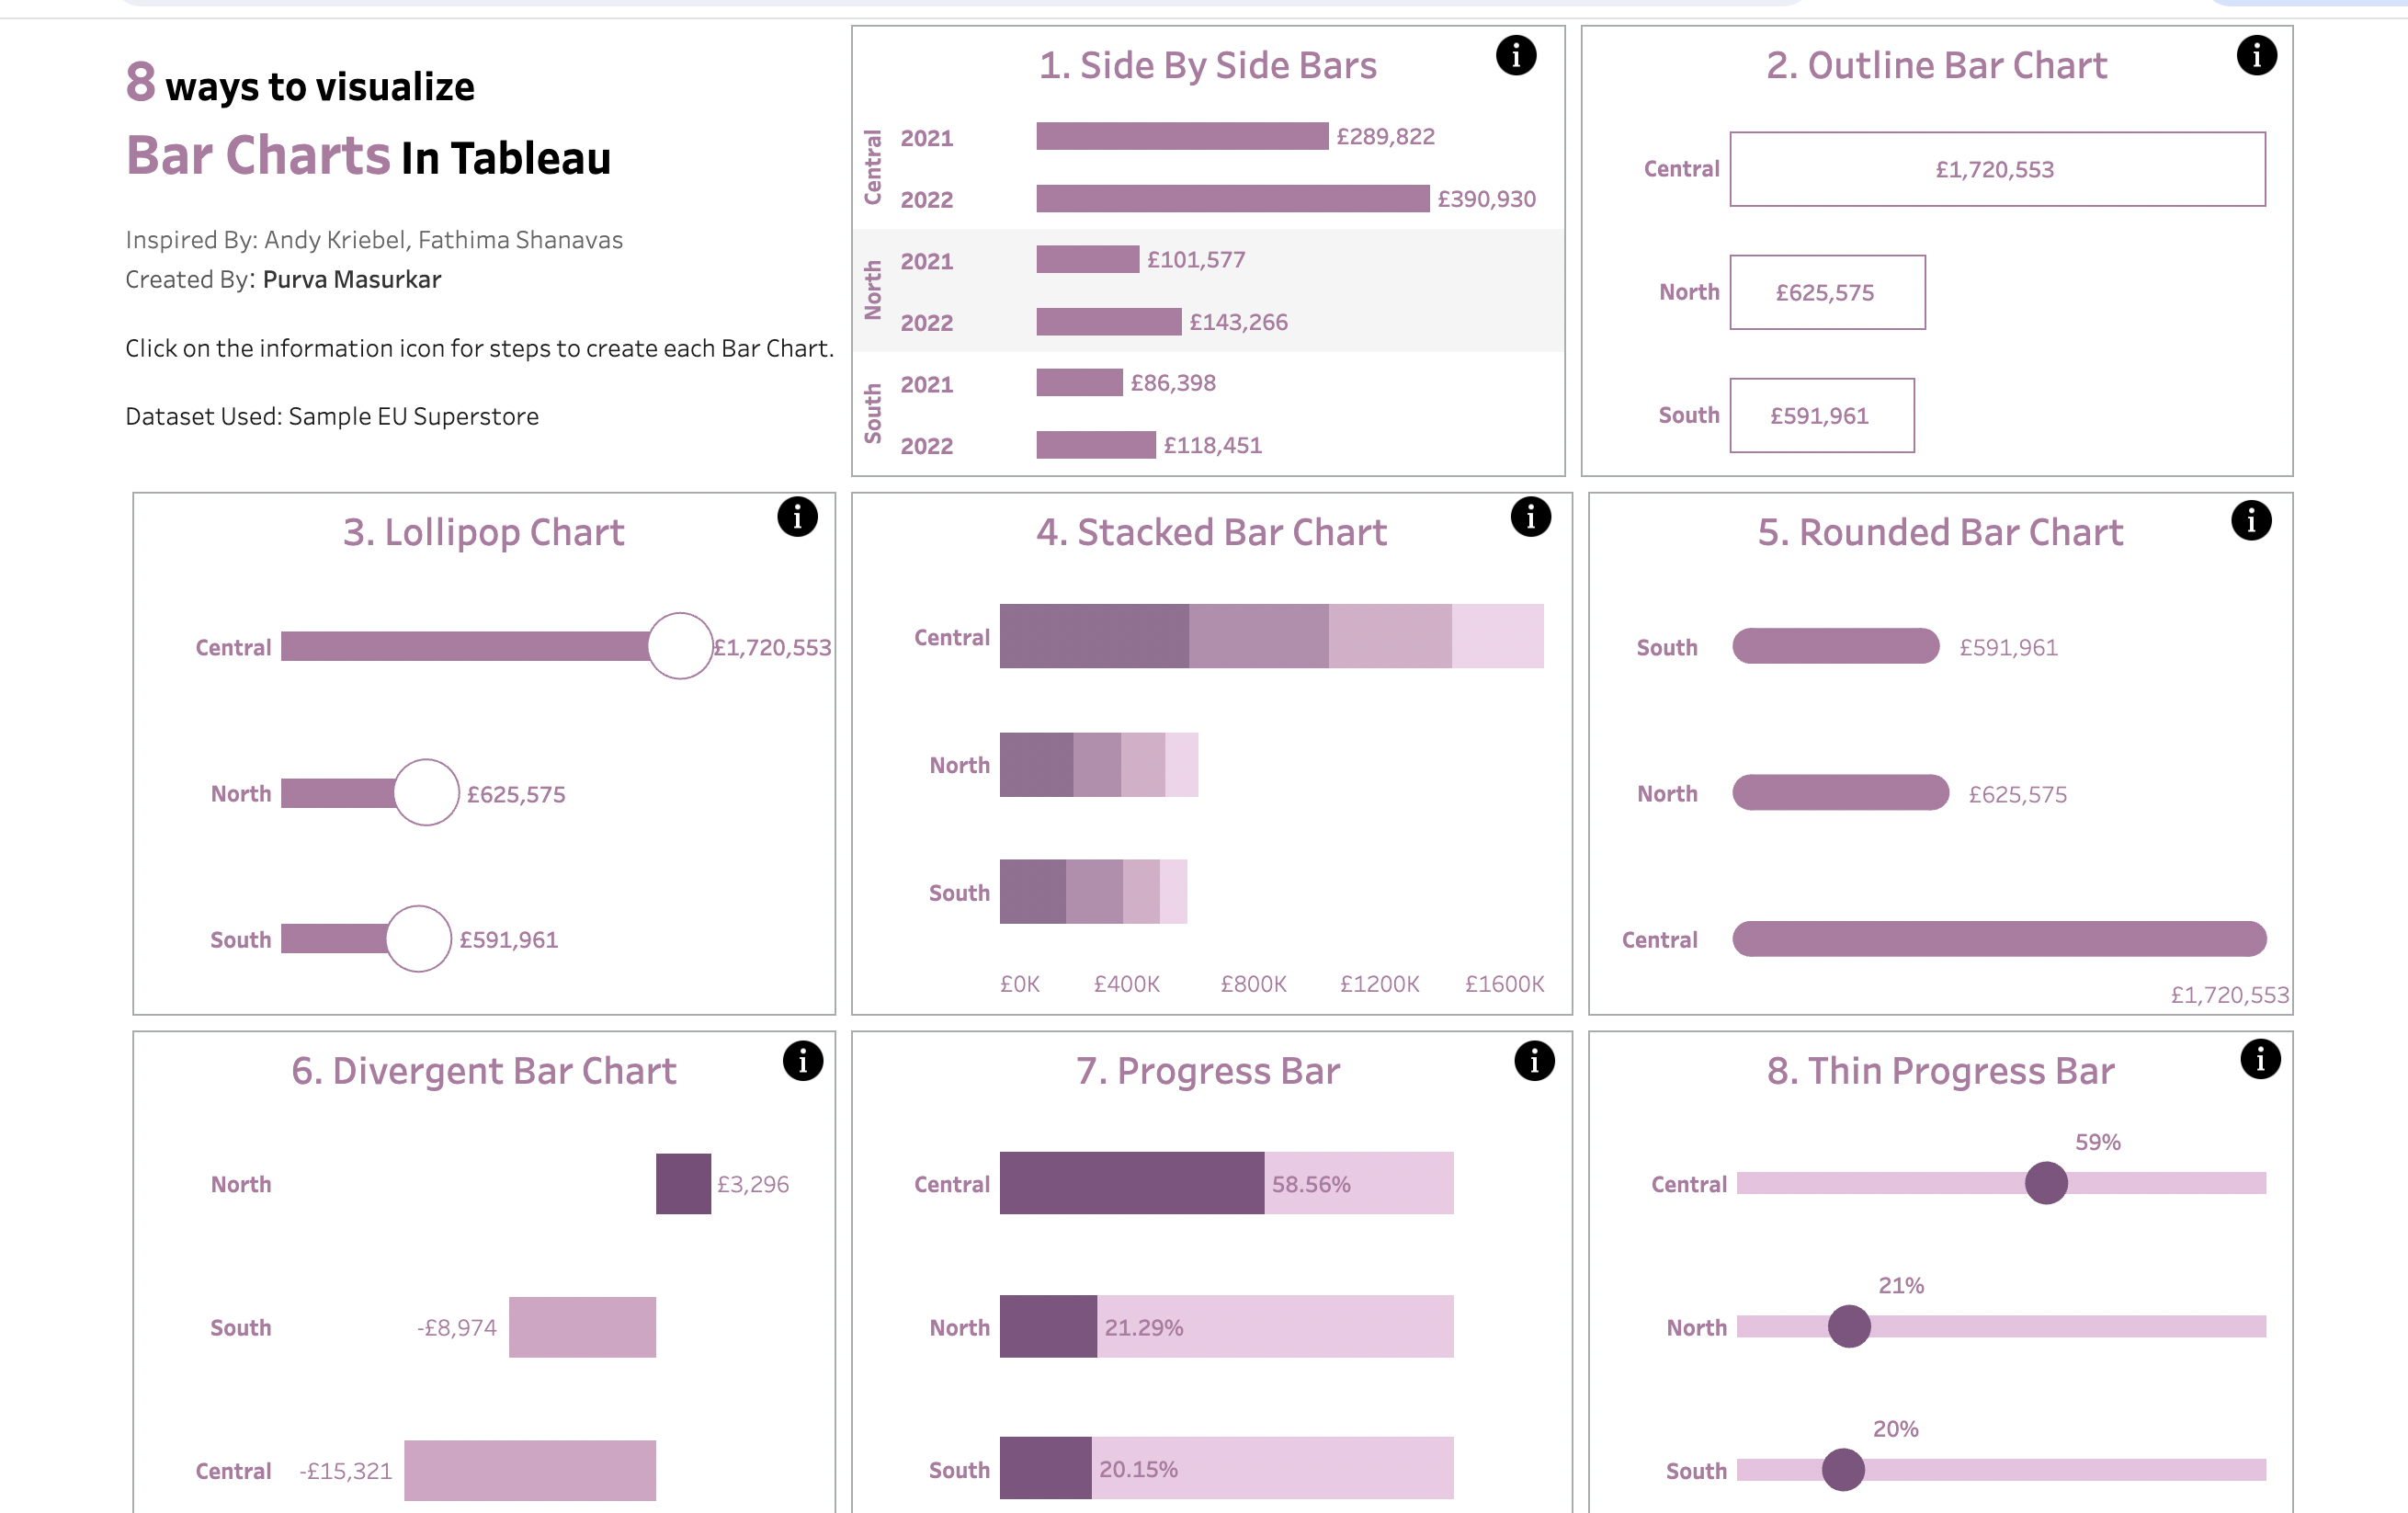
When it comes to learning new visualizations, I often find myself struggling to recall the tricks used to create them when it’s time to work on a project. So I created a dashboard of Bar Charts with step-by-step instructions.
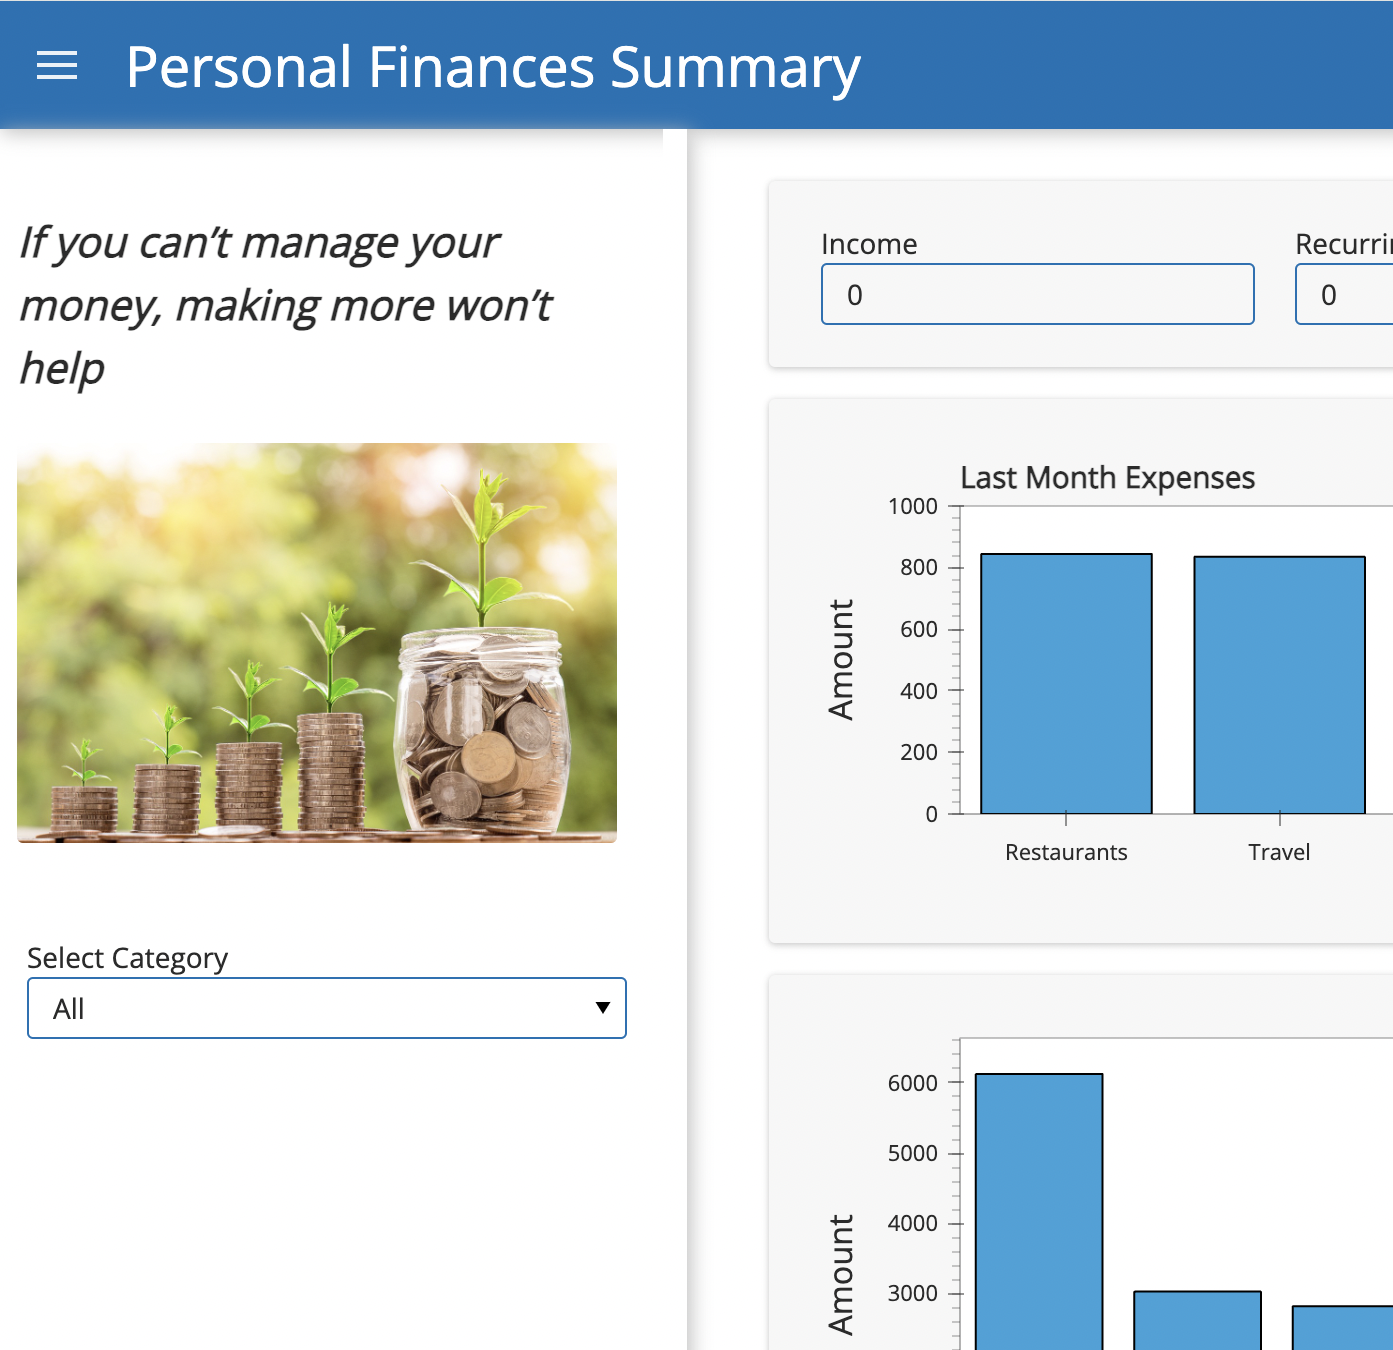
Personal Finances Summary: Python Web hashtag dashboard 📊💰
The “Personal Finances Summary” is a web dashboard created using Python that assists users in managing their finances effectively. This application allows users to input their monthly income, and recurring expenses such as rent, and calculates non-recurring incomes. Additionally, it provides an overview of last month’s savings.
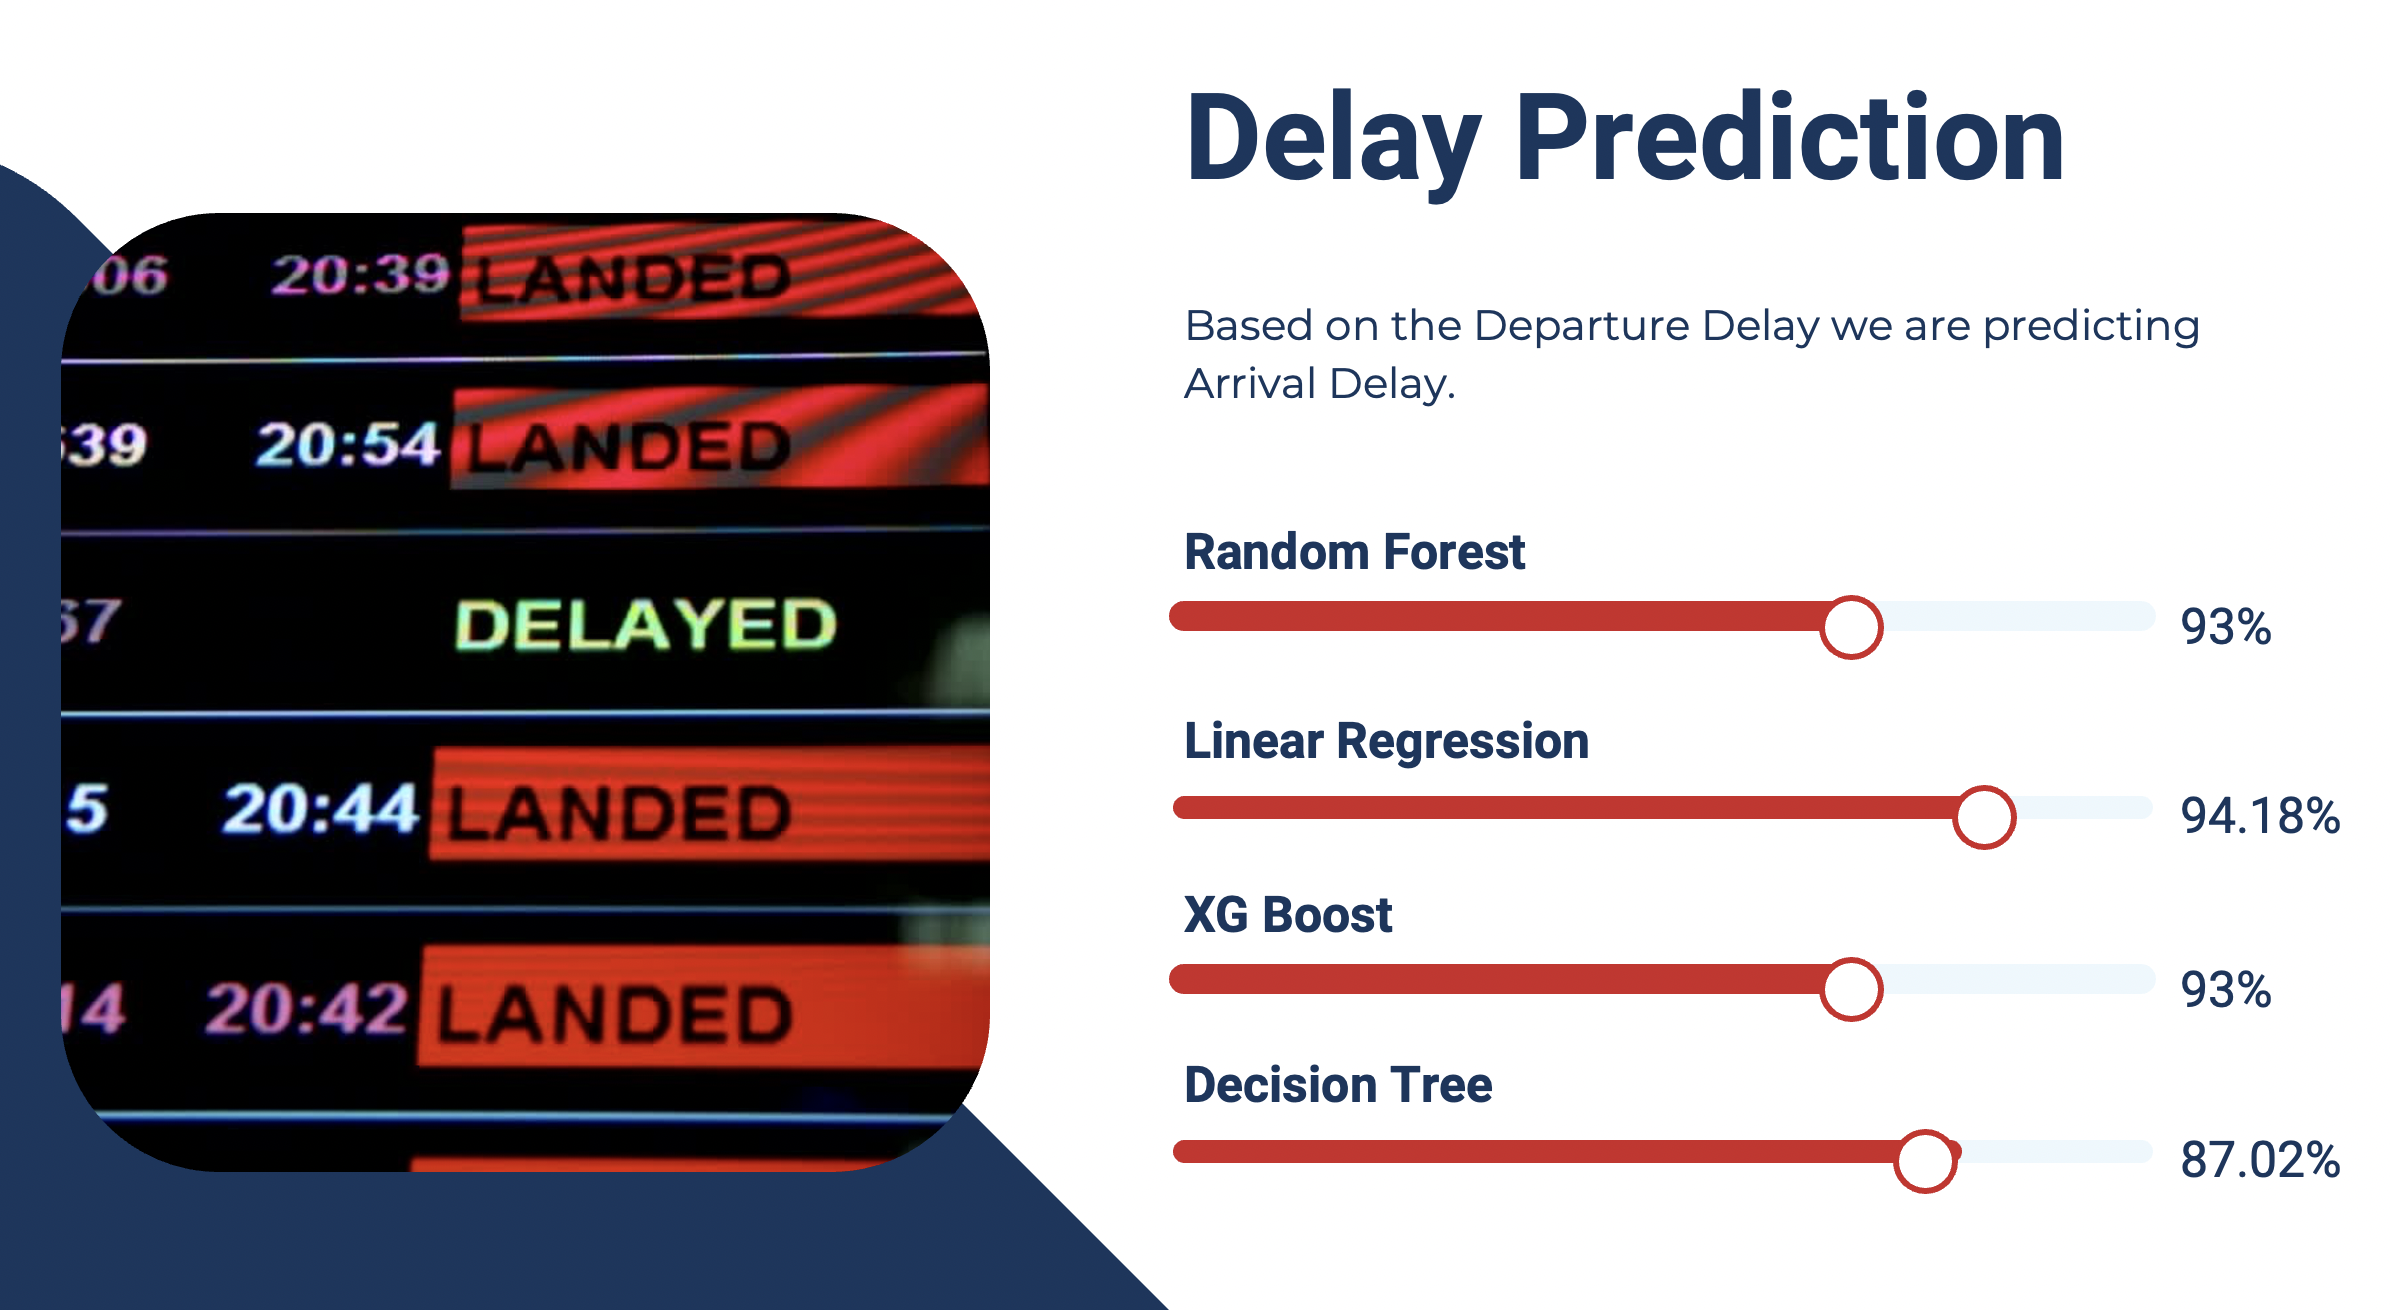
The insights obtained can help airlines, airports, and regulatory authorities make informed decisions to enhance the efficiency and performance of the air transportation system.
FAQ
Frequently Asked Questions
Do you have additional questions that I haven’t answered here? Don’t hesitate to get in touch with me via email by clicking the button below.
What is your Visa Status?
I currently hold an Irish Stamp 1G Visa.
What is your notice period?
I am available to start working immediately.
Where are you based?
I am based out of Dublin, Ireland. I am open to on-site, hybrid, and remote opportunities in Dublin.
Additionally, I am open to hybrid and remote roles anywhere in Ireland.
